- Overview
- Differences from Salesforce reports
- Feature set
- Managing your single-step reports
- A tour of the report editor
- Notes
Overview #
Single-step reports are a quick way to select specific fields of data from specific objects, with any necessary metric calculations, and display them in a tabular or chart format. Such a report is created for a particular base object, and may include fields from multiple objects, i.e., they are cross-object reports. They may include any of the following for display in the report:
- Base object fields, i.e., any fields available directly in the base object.
- Parent and child object fields, i.e., any fields that occur in objects that are one step away via a lookup, either from the base object or to the base object – in other words, fields from parent objects as well as child objects.
- Metric or aggregated values, e.g., number of records, sum of amount, oldest close date, etc.
- Calculated fields that perform custom calculations on the other fields included in the report. For example, in an Opportunity report containing close dates and total amounts, you can add a calculated field that calculates a percentage commission based on how far in the past the close date occurs. These calculations are not stored within Salesforce, but rather are performed on-the-fly,directly within the report.
You can filter the retrieved data based on fields in the base object as well as related objects, and you can sort its outputs based on any of the fields included in it.
For example, when creating an Opportunity report, you can include fields from the Account object, since there is a lookup from Opportunity to Account. In this example, the relationship from Opportunity to Account is many-to-one (many opportunities to one account). You can also include fields from the Opportunity Contact Role object, since there is a lookup from Opportunity Contact Role to Opportunity. And in this example, by contrast, the relationship is one-to-many (one opportunity to many contact roles).
Single-step reports differ from the tabular and console views in that, unlike with those views, you can include fields from related objects, as well as aggregations and calculations, into the report. But you cannot edit the contents of a report in-line, unlike with those views.
Differences from Salesforce reports #
Apsona reports differ from Salesforce reports in some interesting ways.
No “report types” #
Unlike with native Salesforce reports, you don’t need to understand or manage “report types.” When you need a report on an object, you simply select the object’s Reports menu and start building your report.
No 2,000-record limit #
Salesforce reports are limited to 2,000 records. But Apsona reports can produce arbitrarily many records, limited only by the API capacity of your organization.
Automatic de-duplication #
Data records in a report are automatically de-duplicated. For example, if you create a Contact report with no filters, containing just the Salutation field, then your report will display as many records as there are distinct salutations in your database – which is typically no more than 10 – even if you several thousand Contact records. This behavior is intentional, since it allows for easy aggregations. E.g., if you create an Opportunity report containing (only) the Type, Stage and Number of Records, you will get a list of the numbers of opportunities by type and stage. This is made possible because of the automatic de-duplication on the Type and Stage fields. If you want to include duplicates, simply include any field that is unique across the object, e.g., the Record ID for the object, and that will ensure that all duplicate data will flow through to the report output.
More flexibility with usable objects #
Salesforce reports seem to be very limiting in some ways. With Salesforce reports, you need to create report types that can traverse objects from a parent towards its children, and then to its grandchildren, and so forth. For example, you can create a report type that begins at the Account object, uses the Opportunity child object, and then perhaps the Payment child object of the Opportunity. But you cannot traverse objects from a parent to a child and then to a different parent; e.g., you cannot move from Account down to Opportunity and then up to Campaign (since Campaign is a parent of Opportunity). Thus you cannot, for example, create a report that produces the Account records that produced Opportunities from specific Campaigns.
By contrast, Apsona single step reports allow you to navigate your data model in any direction you wish. In this example, it is quite easy to create an Opportunity report that only includes fields from its two parent objects, Account and Campaign, to produce information about what Account records produced Opportunities from a given list of Campaigns.
Feature set #
Some features of Apsona single-step reports are particularly worth discussing in a bit more detail.
Cross-object reporting #
When you create a single-step report on a particular object, you can include fields from that object as well as its parent and child objects, as noted in the overview. For example, in an Opportunity report, you can include fields from the Opportunity object, its parent Account object, its parent Contact object, as well as fields from child objects such as Opportunity Contact Role or Opportunity Line Item. You can also include filter terms involving fields from these other objects.
Metric (aggregate) values #
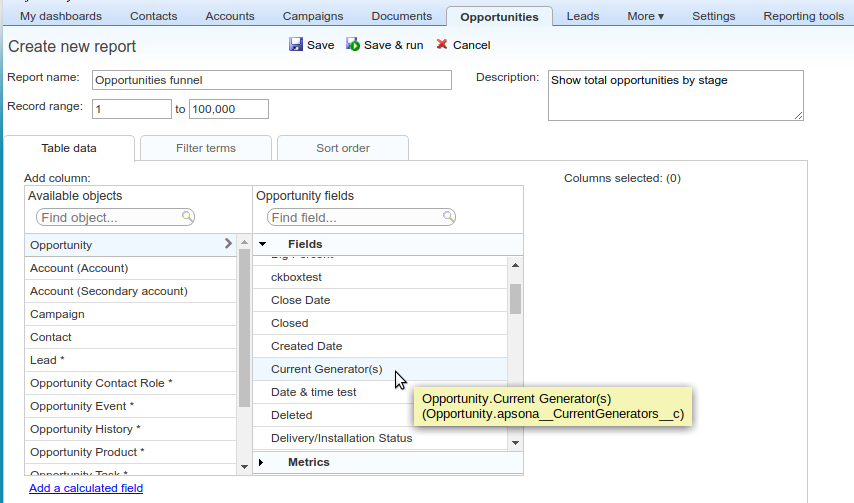
An aggregate value of a field is just a calculation of a few commonly-used functions on the field. For numeric fields, the allowed calculations are sum, count, largest, smallest and average. For non-numeric fields, the allowed ones are the largest, smallest and count of distinct values. You can set up record filtering criteria based on metric or aggregate values (as you would in a filter), but you can also include aggregate values as columns in a report. Below is an example screen shot showing how to select an aggregate function of the Amount field of the Opportunity object.

Mixing aggregate and non-aggregate columns #
When you create a report that contains both aggregate and non-aggregate columns, you are telling Apsona to:
- extract all the rows that meet the filter condition of the report (or, if there is no filter, then all rows in the object);
- then de-duplicate over the non-aggregate columns;
- and finally, use the resulting deduplicated rows to calculate the aggregate values.
Consider a few examples to see how this works. Suppose, for simplicity, that we are retrieving Opportunity records, with a filter condition that the close date is within the last two years.
Just one column #
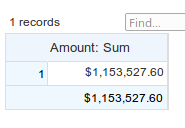
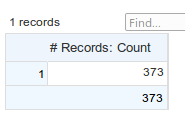
If we have just one column in the report, e.g., the sum of Amount column (an aggregate), then the report will produce a single row containing the total Amount of all opportunities whose close date is in the last two years. Similarly, if we have just one column which is the count of records (an aggregate), it will produce a single row containing the number of opportunities in the last two years (screen shots below).
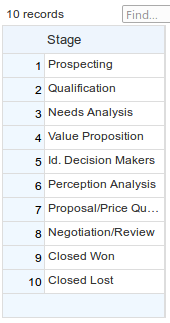
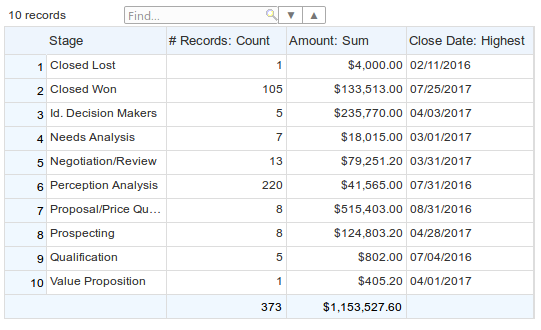
For comparison, if we have just one non-aggregate column, we will see as many rows as there are distinct values in that field (regardless of how many actual data records there are in the object), because of the deduplication mentioned above. Below is the report with just the Stage column in it, showing only 10 rows, because (in this org’s data) there are ten distinct stages that occur among all the Opportunities over the last two years:
Aggregate columns only #
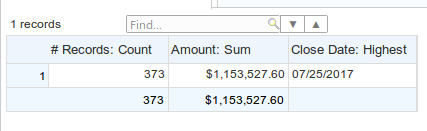
We can add multiple aggregate columns to the report. Say we had three columns in the report, the sum of Amount, the record count, and the largest close date. The report will still produce just one row containing those three aggregate columns.
One non-aggregate, multiple aggregates #
Now let’s say we have four columns in the report: one non-aggregate column for the Stage, and three aggregate columns for the record count, the sum of amount and the newest close date. In this case, because of the de-duplication over the non-aggregate Stage column, we will get as many rows as there are distinct stages among the opportunities in the last two years. If there are a total of ten distinct stages among the opportunities meeting the filter condition, then the report produces ten rows, because it de-duplicates over the Stage, which is the only non-aggregate column in it. (Notice that this might not include all possible opportunity stages, e.g., if a particular stage never occurs among the opportunities in the report’s filter, then that stage will not appear in the report’s output.) And for each output row, the record count column will contain the number of opportunities in the stage of that row in the last two years, and the sum of amount column will contain the total of amount for opportunities in that stage for the last two years. So we obtain the breakdown of the aggregate values by Stage.
Multiple aggregate and non-aggregates #
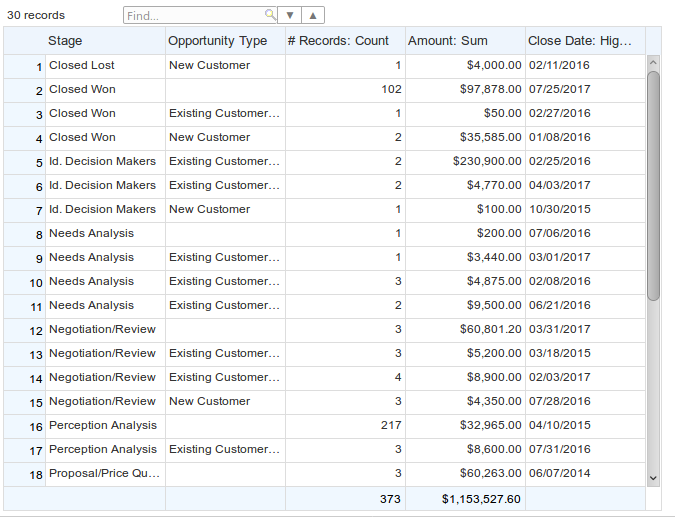
If we add one more column – say Opportunity Type – to the above report, we’ll get as many rows as there are distinct [Opportunity Type, Stage] pairs among those opportunities, and the corresponding counts and total amounts. So in effect, we get a breakdown of the aggregate numbers by Type and Stage.
Notice that the more non-aggregate columns we add, the further the aggregates break down. In an extreme case, if we add the Opportunity ID to the report, then the non-aggregate fields cannot be de-duplicated (since no two opportunity records can have the same ID), so we’ll find that the sum of amount field, will become identical to the amount field, and the record count field will be 1 for all rows in the report.
Aggregate values vs calculated fields #
Single-step reports can include both aggregate values and calculated fields. An aggregate value produces a sum, count, minimum or maximum value of a particular field over the selected range of records, as described above. For example, in an Account report, you can add an aggregate value for the total of the Expected Amount field of all (or selected) Opportunities linked to each Account in the report. In contrast, a calculated field is specified using a JavaScript formula, and is calculated separately for each output record of the report. For example, in the above example report containing a field Total Expected Amount, you can create a calculated field
{!Total Expected Amount} * 0.15
to calculate a 15% commission paid on the opportunities for each account. The report’s output will include the calculation for each output row. Similarly, you can create a column that calculates the conditional expression
{!Total Expected Amount} > 1.0E6 ? "Gold" : {!Total Expected Amount} > 1.0E3 ? "Silver" : "Bronze"
Read the the above expression as follows: If Total Expected Amount exceeds 1.0E6 (i.e., 1 million), then the value of the field is the string Gold; otherwise, If Total Expected Amount exceeds 1.0E3 (i.e., 1 thousand), then the value of the field is the string Silver; otherwise, it is Bronze. Notice that the field names in the expressions are surrounded by {! and } (starts with left curly brace and exclamation point, ends with right curly brace).
Detailed documentation about JavaScript-based calculated fields is available.
Equi-joins vs left joins #
When producing a report containing fields from two related objects, you can (obviously) use either object as the base object. But the report behaves differently depending on which object is chosen as base. To illustrate, consider a report that contains fields from the Account and Opportunity objects, where there is a natural one-to-many relationship from Account to Opportunity, i.e., one Account corresponds to one or more Opportunities. (Equivalently, the Account is the parent object and the Opportunity is the child object.) If you select the Account object as base, you can create a report in which an account record is produced even if it has no corresponding opportunity record. In this situation, any row in the report output that contains such an account record will have its opportunity fields empty. This is referred to as a left join between the Account and the Opportunity object.
By contrast, if you select the Opportunity object as the base, you can add into the report the same fields as in the above example; but in this report, there will be no account records without opportunities. This is because, given that its base object is Opportunity, it is driven by the existence of the Opportunity record rather than the Account record. This structure is referred to as an equi-join.
Thus the join that Apsona uses depends on the base object you select.
Managing your single-step reports #
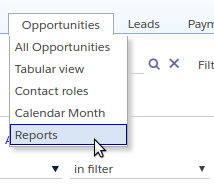
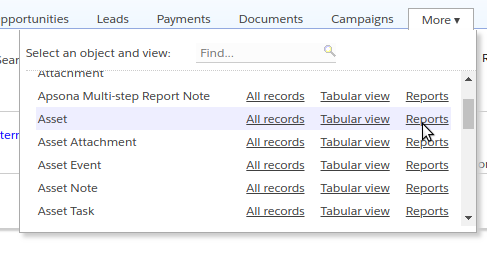
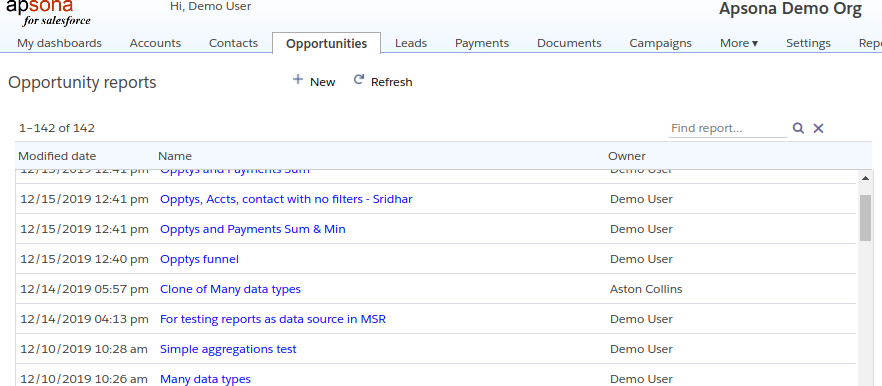
A Reports menu item is available within each object’s menu in the menu bar, via which you can access the list of reports for that base object. For objects available in the More menu, there is also a Reports menu item to access their reports.
When you access the reports for a particular object in this way, Apsona shows a list of reports for just those objects, without any report folders displayed.
The “All reports” view #
You can access a consolidated list of all your single step reports via the menu choices of Reporting tools – Single-step Reports. This view offers folder-based management of your reports. At left is a list of shortcuts and folders, and at right is the list of reports in the selected folder or shortcut.
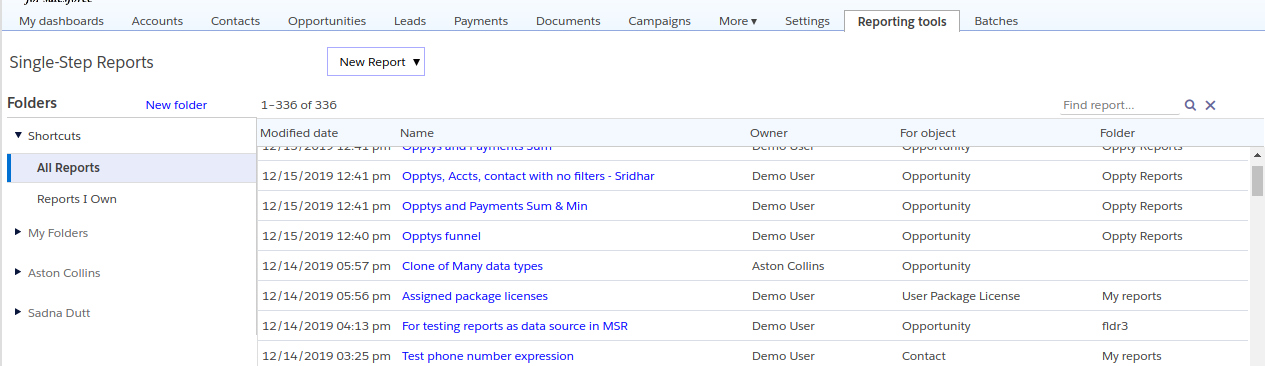
Shortcuts #
The “All Reports” shortcut displays a list of all the reports accessible to you, while the “Reports I Own” shortcut shows just the reports you own.
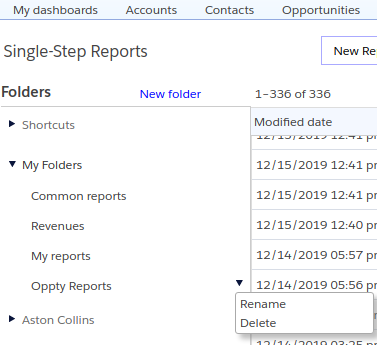
Folders and folder management #
Below the shortcuts is a list of your folders under the “My folders” section, followed by folders that each user owns, in alphabetical order by user name.
- To create a new folder, click the “New folder” button at the top of the FOlders section.
- To rename or delete an existing folder, hover over the folder name, and click the down-arrow icon, and then select the approproiate menu item. See screen shot below.
- To move a report to a particular folder, hover over the folder cell for the report, and click the “Move” icon.
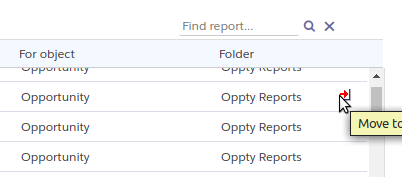
This displays a dropdown containing the candidate folders into which you can move the report. Simply select the folder to which you want the report moved.Note that, if you are an administrator, the dropdown contains all folders owned by all users, so you can move the report to any user’s folder. But if you are not an administrator, the dropdown displays only the folders that you own.
A tour of the report editor #
Creating a report #
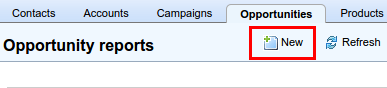
To create a report for a particular object, click the Reports menu for that object, and then click the New button at the top.
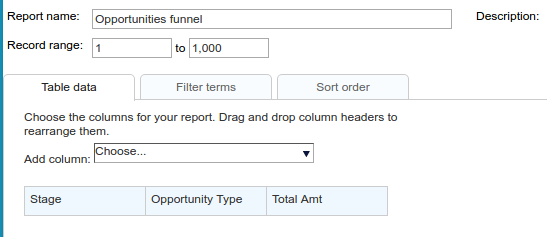
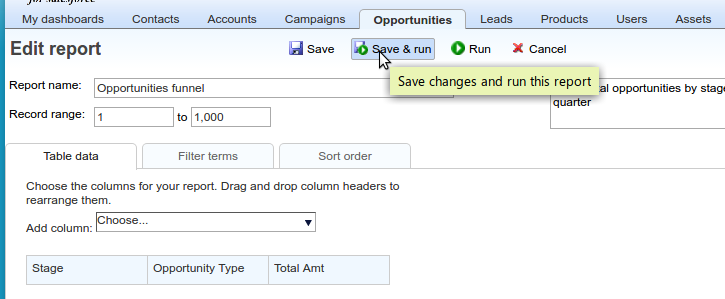
You will now see the report creation screen, where you can provide a name and optional description for the report. You can then proceed to add fields to the report by clicking the “Add column” chooser, and you can set filtering and sort conditions in the “Filter terms” and “Sort order” tabs respectively.
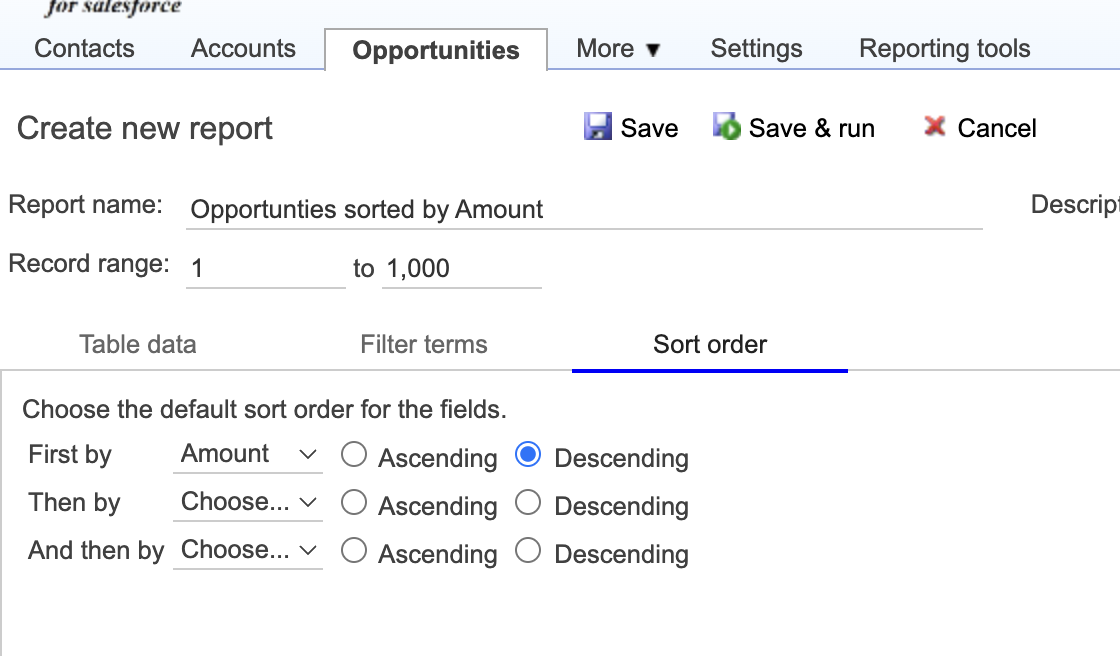
Sorting and selecting a record range #
Note in the screen shot above that you can specify the range of records to retrieve. The screen shot shows 1 to 1,000 indicating the first 1000 rows. If, for instance, you chose to sort an Opportunity report by Amount descending, and selected the record range 1 to 10 (as in the screen shot below), you would be retrieving just the top 10 opportunities by amount.
Adding fields and metrics #
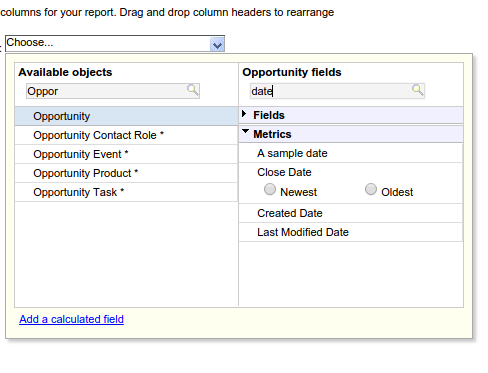
Clicking the “Add column” chooser produces the field chooser window similar to the screen shot below. In the left panel of this window, labeled Available objects, are shown the objects from which you can draw fields to include in the report. When you select one of those objects by clicking on it, the right panel displays the fields and metrics available from that object. Notice the “Find..” box at the top of each panel, via which you can quickly find objects or fields in that panel.
Available objects #
The list of available objects includes all objects accessible to you (based on your Apsona configuration) that are one step away from the current object via a lookup (i.e., either it must have a lookup to the base object, or the base object must have a lookup to it). In the above example screen shot, which shows the Opportunity object, we see the Account, Campaign, Contact, and Opportunity Contact Role objects, among others. A few things to note here:
- The first (topmost) entry in this list is always the base object (the one for which the report is being built). The remaining entries are listed in alphabetical order.
- When there is more than one lookup to the same object, each lookup contributes a separate entry into the left panel. In this example, our Opportunity object contains two lookups to the Account object – one called Account, and a second one called Secondary account. Therefore, there are two potentially different Account records associated with any given Opportunity. For this reason, there are two different entries in the left panel, one labeled
Account (Account)and the other labeledAccount (Secondary account). This allows you to show fields from the Opportunity record as well as fields of its Account and Secondary account records in report, e.g., when you want to produce a single report containing Opportunity information as well as information about both primary and secondary accounts. - If the relationship from the base object to the other object is one-to-many, an asterisk is shown next to the entry. For example, in the above screen shot, we see asterisks next to the Opportunity Contact Role object, indicating that the relationship from Opportunity to Opportunity Contact Role is one-to-many.
Fields and metrics #
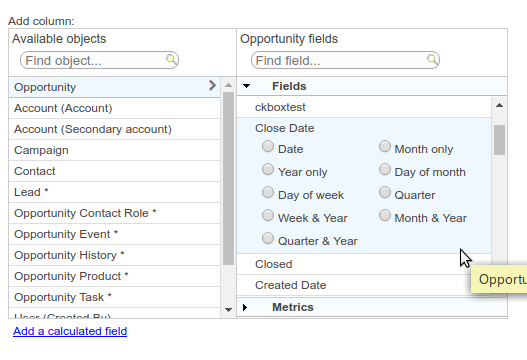
The right panel shows the fields and metrics available for the object. This panel has two sections: a top section containing the fields of the object, and a bottom section containing available metrics. Clicking the section label (“Fields” or “Metrics”) opens the corresponding section. The screen shot below shows the “Fields” section open, via which we can select one of the fields to include. Simply clicking the field causes it to be selected and added to the report. If we select a date field, we can also request just parts of the date (e.g., Month or Year) instead of the entire date value, as seen below. If you select a particular object in the Available objects list, all the fields of that object, except lookup fields, will appear in the fields list. The reason for the exception for lookup fields is that they potentially refer to objects that are outside the one-lookup-away rule. There a few special cases, though: Lookups to the Campaign and User objects are always available as a convenience, because they are needed in a large number of common use cases.
In the Metrics section, clicking an entry in the section shows the metrics available for that entry, so that you can select one to add to the report. Every date, number or currency field is available among the metrics, along with the appropriate aggregation operators (sum, max, min and average for numbers and currencies, and oldest and newest for date fields). For example, in the screen shot below, the metrics section is open, with the Close Date field selected so that we can add either the oldest or newest close date metric to the report. Note also, in this screen shot, that we have used the “Find” boxes to restrict the objects and fields displayed.
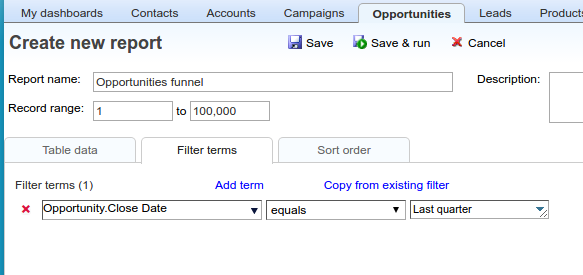
Setting up filter criteria #
The “Filter terms” tab allows us to add any necessary filtering criteria for the report, as shown below. The mechanism for creating and editing a filter in this tab is identical to that elsewhere in Apsona. More details are available about creating filters. Note also that, if you have an existing filter you wish to use in the report, you can simply click the “Copy from existing filter” link to select and copy the filter for use in the report.
Editing the report #
The fields added to the report are displayed in a horizontal list. When a field is added to the report, it shows as the last added field the report. In the screen shot below, we have added three two fields, Stage and Probability, and a metric Amount: Sum.
Rearranging fields #
You can simply drag and drop the fields in the horizontal display of fields to rearrange their order.
Renaming fields #
Hovering over any of the fields shows icons for editing and deleting the field. Clicking the edit icon displays a small popup window via which you can change the name of the field as it appears in the report (i.e., its column header), as indicated in the screen shot below.

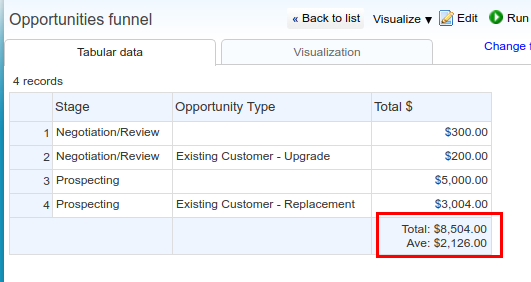
Producing column summaries for numeric fields #
When you click the edit icon for a numeric field, such as a number, currency or integer field, the popup window includes checkboxes for “summary” functions Sum, Max, Min and Average. Checking one or more of these boxes will produce the corresponding summary value in the footer of the resulting report. For example, with the Sum and Average checkboxes checked for the “Total $” field as in the above screen shot, the result is shown below.
Running a report #
To save and run the report being edited, simply click the “Save & run” button.
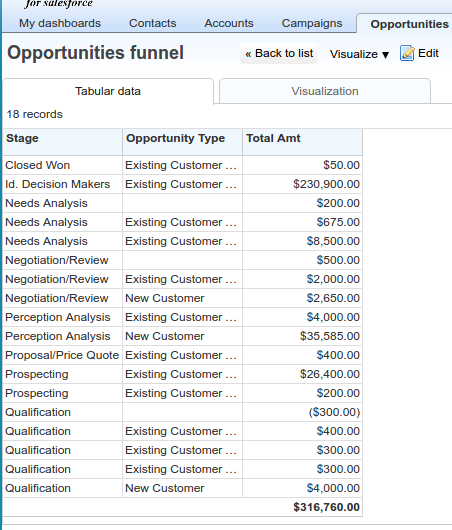
In our example, this produces the following display.
Running a report with incremental changes #
Frequently, you will have access to a report that has been set up in a final form, and you would want to make “incremental” changes to it before running it – changes that you do not wish to be saved in the report. For example, if you are running a large email merge off a report, you might want to run it once with record range 1–100, and again with range 101–200, and then again for 201–300 but never save those changes. You can achieve this affect by clicking “Edit”, making your changes, and then clicking “Run” rather than “Save & run”. Clicking the Run button runs the report in its current state, including any changes you made, but does not save the report.
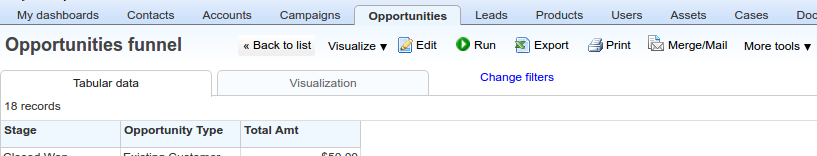
Exporting, printing and document generation #
The report results are displayed with a tool bar with buttons for exporting the results in CSV format, printing them, or generating documents from them.
Notes #
- When you create a report, it stores the API names of the fields within the report representation, for the columns you have selected and for the fields in the filter criteria. This is because Apsona relies on the API name to uniquely identify the field. So if you subsequently change the API name, the report will be unable to find the field and will fail to run.