Table of Contents
Opportunity growth year-over-year, by Campaign #
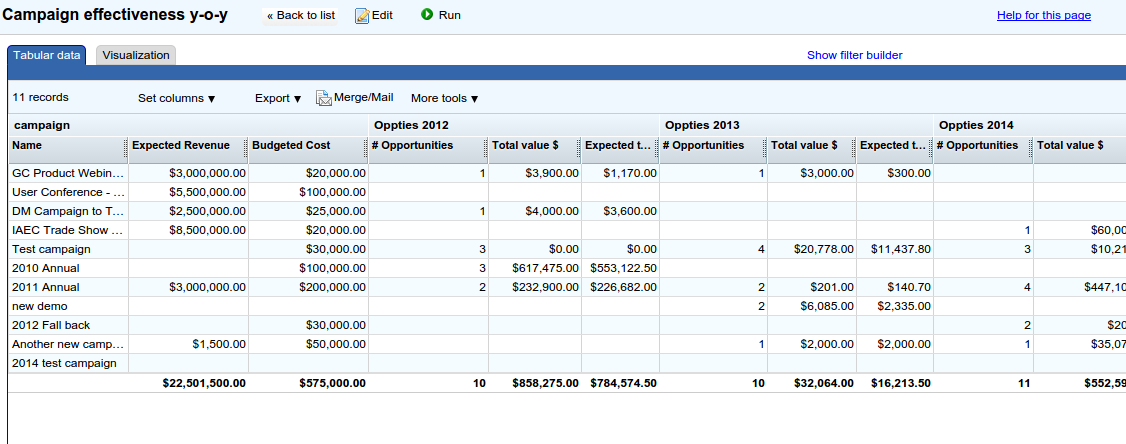
This example shows a report that displays year-over-year variation of Opportunity count and Opportunity value, summarized by Campaign. Below is a screen shot with some dummy data.
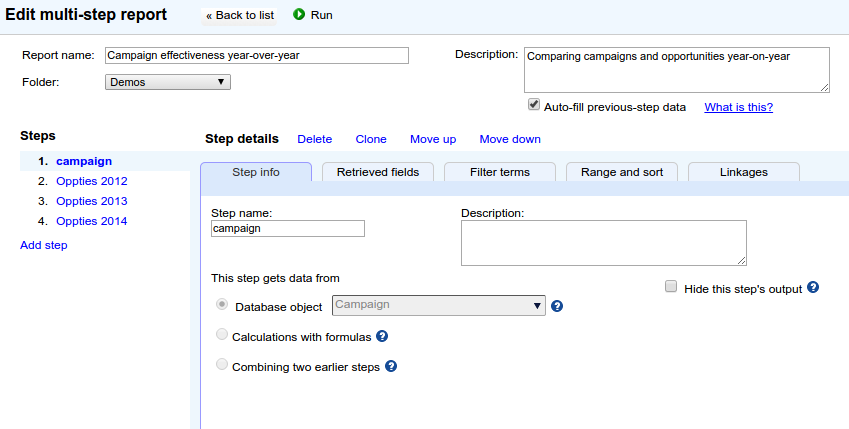
The report uses four steps.
- The first step retrieves data from the Campaign object, filtered to obtain a selected set of Campaigns.
- The second step retrieves data from Opportunity object. It retrieves the Campaign ID field and the necessary opportunity metrics, and is filtered on Opportunities closing in 2012. It is linked to the first step on the Campaign ID field.
- The subsequent steps are identical to the second step, except that they vary their filter condition to suit the correct year (2013, 2014 etc). So the subsequent steps are produced by cloning the first step, changing the filter condition to the appropriate year, and linking on the Campaign ID field
Below is a screen shot of this report. You can also download this report and add it to your org.